sched-ext Tutorial
Extensible Scheduler Class (better known as sched-ext) is a Linux kernel feature which enables implementing kernel thread schedulers in
BPF (Berkeley Package Filter) and dynamically loading them. Essentially, this allows end-users to change their schedulers in userspace without
the need to build another kernel just to have a different scheduler.
-
The schedulers can be found in the
scx-schedsandscx-scheds-gitpackage.Terminal window # Stable branch + scx_loader and scxctl tools.sudo pacman -S scx-scheds scx-tools# Bleeding edge branch (This branch includes the latest changes from the master branch.) + scx_loader and scxctl tools.sudo pacman -S scx-scheds-git scx-tools-git
How to Launch and Manage the Scheduler
Section titled “How to Launch and Manage the Scheduler”- To start the scheduler, open your terminal and enter the following command:
Example of starting rusty sudo scx_rusty
This will launch the rusty scheduler and detach the default scheduler.
To stop the scheduler. Press CTRL + C and the scheduler will then be stopped and the default kernel scheduler will take over again.
scxctl is a CLI DBUS client for interacting with scx_loader.
- Features:
- Get the current scheduler and mode
- List all available schedulers
- Start a scheduler in a given mode, or with given arguments
- Switch between schedulers and modes
- Stop the running scheduler
- Restart the running scheduler
scxctl start --sched flash --mode gamingscxctl stopscxctl restorescxctl switch --sched bpfland --mode gamingscxctl start --sched cosmos --args="-c,75,-m,0-15"scxctl switch --sched flash --args="-s,20000"$ scxctl --helpUsage: scxctl <COMMAND>
Commands: get Get the info on the running scheduler list List all supported schedulers start Start a scheduler in a mode or with arguments switch Switch schedulers or modes, optionally with arguments stop Stop the current scheduler restart Restart the current scheduler with original configuration restore Restore the default scheduler from configuration help Print this message or the help of the given subcommand(s)
Options: -h, --help Print help -V, --version Print versionAs the name implies, it is a utility that functions as a loader and manager for the sched-ext framework using the D-Bus interface.
While it does not require systemd, it can still be utilized in conjunction with it. Check the transition guide for reference.
- Has the ability to stop, start, restart, read information about a scx scheduler and more.
- You can use tools like
dbus-sendorgdbusto communicate with it.
- You can use tools like
- This guide explains how to use scx_loader with the dbus-send command.
-
Starting scx_rusty with its default arguments dbus-send --system --print-reply --dest=org.scx.Loader /org/scx/Loader org.scx.Loader.StartScheduler string:scx_rusty uint32:0 -
Starting a scheduler with arguments # This example starts scx_bpfland with the following flags: -k -c 0dbus-send --system --print-reply --dest=org.scx.Loader /org/scx/Loader org.scx.Loader.StartSchedulerWithArgs string:scx_bpfland array:string:"-k","-c","0" -
Stopping the currently running scheduler dbus-send --system --print-reply --dest=org.scx.Loader /org/scx/Loader org.scx.Loader.StopScheduler -
Switch to the default scheduler # scx_loader will switch to the default scheduler set in the scx_loader config filedbus-send --system --print-reply --dest=org.scx.Loader /org/scx/Loader org.scx.Loader.RestoreDefault -
Switching to another scheduler in Mode 2 dbus-send --system --print-reply --dest=org.scx.Loader /org/scx/Loader org.scx.Loader.SwitchScheduler string:scx_lavd uint32:2# This switches to scx_lavd with the scheduler mode 2 meaning it starts LAVD in powersaving -
Switching to another scheduler with arguments dbus-send --system --print-reply --dest=org.scx.Loader /org/scx/Loader org.scx.Loader.SwitchSchedulerWithArgs string:scx_bpfland array:string:"-k","-c","0" -
Getting the currently running scheduler dbus-send --system --print-reply --dest=org.scx.Loader /org/scx/Loader org.freedesktop.DBus.Properties.Get string:org.scx.Loader string:CurrentScheduler -
Getting a list of the supported schedulers dbus-send --system --print-reply --dest=org.scx.Loader /org/scx/Loader org.freedesktop.DBus.Properties.Get string:org.scx.Loader string:SupportedSchedulers
-
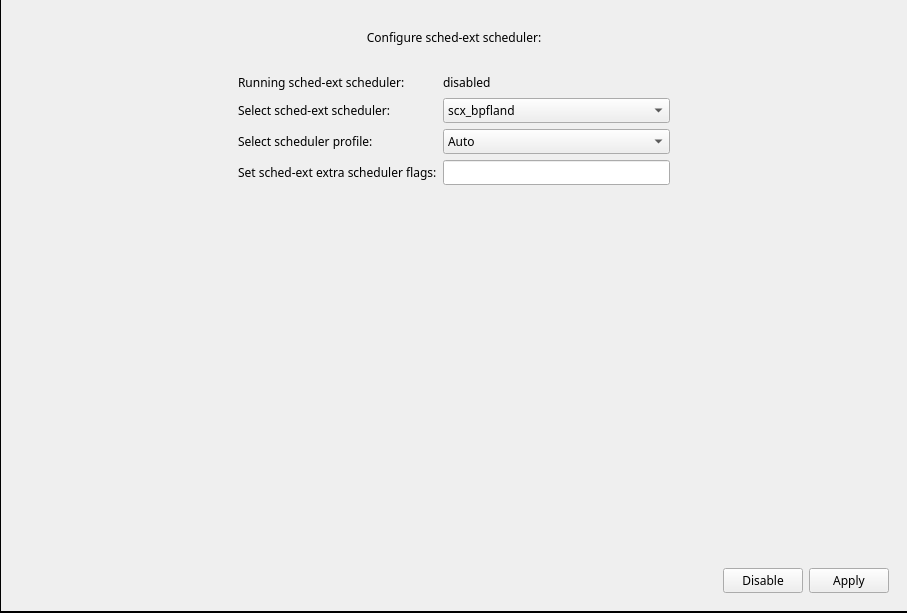
You can access and configure them via the sched-ext scheduler config button.
SCX Manager is a standalone GUI tool derived from the CachyOS Kernel Manager. It allows users to manage the sched-ext framework and its schedulers through the scx_loader.
Features:
- Check which scheduler is currently active
- Select a scheduler or profile: (Auto, Gaming, Power save, Low Latency or Server)
- Set additional flags
- Disable the current scheduler
Screenshot
Scheduler Guide: Profiles and Use Cases
Section titled “Scheduler Guide: Profiles and Use Cases”Since there are many schedulers to choose from, we want to give a little introduction about the schedulers in hand.
Feel free to report any issue or feedback to their scheduler repository.
Use scx_schedulername --help to see the available flags and a brief description of what they do.
scx_rusty --helpDeveloped by: Andrea Righi (arighi GitHub)
Production Ready?
scx_beerland is a scheduler designed to prioritize locality and scalability.
Prioritizes keeping tasks on the same CPU to maintain cache locality, while also ensuring good scalability across many CPUs by using local DSQs (per-CPU runqueues) when the system is not saturated.
- Use cases:
- Cache-intensive workloads
- Systems with a large amount of CPUs
- Gaming: Works surprisingly well in certain games, although your mileage may vary.
- Server: Good for general purpose server workloads due to its scalability and locality optimizations.
- Can be used for desktop usage as well.
Scheduler Modes
Section titled “Scheduler Modes”None for the moment.
Developed by: Andrea Righi (arighi GitHub)
Production Ready?
A vruntime-based sched_ext scheduler that prioritizes interactive workloads. Highly flexible and easy to adapt.
Bpfland when making decisions on which cores to use, it takes in consideration their cache layout and which cores share the same L2/L3 cache leading to fewer cache misses = more performance.
- Use cases:
- Gaming
- Desktop usage
- Multimedia/Audio production
- Great interactivity under intensive workloads
- Power saving
- Server
Scheduler Modes
Section titled “Scheduler Modes”Low Latency
Section titled “Low Latency”- Command-line Flags:
-m performance -w - Description: Meant to lower latency at the cost of throughput. Suitable for soft real-time applications like Audio Processing and Multimedia.
Power Save
Section titled “Power Save”- Command-line Flags:
-s 20000 -m powersave -I 100 -t 100 - Description: Prioritizes power efficiency. Favors less performant cores (e.g E-cores on Intel).
Server
Section titled “Server”- Command-line Flags:
-s 20000 -S - Description: Prioritize tasks with strict affinity. This option can increase throughput at the cost of latency and it is more suitable for server workloads.
Developed by: RitzDaCat (RitzDaCat GitHub)
- Production Ready?
scx_cake is an experimental BPF CPU scheduler that adapts the network CAKE algorithm’s DRR++ (Deficit Round Robin++) for CPU scheduling.
- 4-Tier Classification — Tasks sorted by EWMA avg_runtime into Critical / Interactive / Frame / Bulk
- Zero Global Atomics — Per-CPU BSS arrays with MESI-guarded writes eliminate bus locking
- Kernel-Delegated Idle Selection — scx_bpf_select_cpu_dfl() for authoritative, zero-staleness CPU selection
- Per-LLC DSQ Sharding — Eliminates cross-CCD lock contention on multi-chiplet CPUs
- DRR++ Deficit Tracking — Network CAKE’s flow fairness algorithm adapted for CPU task scheduling
Designed for gaming workloads on modern AMD and Intel hardware.
- Use cases:
- Gaming
4-Tier System
Section titled “4-Tier System”scx_cake classifies every task into one of four tiers based on its EWMA (Exponential Weighted Moving Average) runtime. Classification is automatic and continuous — tasks move between tiers as their behavior changes.
Tier Gates
Section titled “Tier Gates”| Tier | Name | avg_runtime | Typical Workload | Quantum | Starvation |
|---|---|---|---|---|---|
| T0 | Critical | < 100µs | IRQ handlers, input drivers, audio (PipeWire), network | 0.5ms | 3ms |
| T1 | Interactive | < 2ms | Compositors, game physics, game AI, short workers | 2.0ms | 8ms |
| T2 | Frame | < 8ms | Game render threads, video encoding | 4.0ms | 40ms |
| T3 | Bulk | ≥ 8ms | Compilation, background indexing, batch jobs | 8.0ms | 100ms |
How Classification Works
Section titled “How Classification Works”- Initial placement: Based on
nicevalue —nice < 0→ T0,nice 0-10→ T1,nice > 10→ T3 - Runtime authority: After ~3 stops, the EWMA avg_runtime becomes authoritative. A nice -5 task that runs 50ms bursts will reclassify to T3 regardless of nice value.
- Hysteresis: 10% deadband prevents oscillation at tier boundaries. Promotion requires avg_runtime clearly below the gate; demotion is immediate.
- Graduated backoff: Once a tier is stable for 3+ consecutive stops, reclassification frequency drops per-tier: T0 rechecks every 1024th stop, T3 every 16th. Instability resets to full-frequency checking.
DRR++ Deficit Tracking
Section titled “DRR++ Deficit Tracking”Adapted from network CAKE’s flow fairness:
- Each task starts with a deficit (quantum + new-flow bonus ≈ 10ms credit)
- Each execution bout consumes deficit proportional to runtime
- When deficit exhausts → new-flow bonus removed → task competes normally
- This gives newly spawned threads (game launching a worker) instant responsiveness that naturally decays
DVFS (CPU Frequency Scaling)
Section titled “DVFS (CPU Frequency Scaling)”Each tier maps to a CPU performance target via RODATA lookup table:
| Tier | Target | Rationale |
|---|---|---|
| T0-T2 | 100% (max frequency) | Gaming workloads need full performance |
| T3 | 75% | Background work can run slightly slower to save power |
On Intel hybrid CPUs (has_hybrid = true), targets are scaled by each core’s cpuperf_cap to prevent over-requesting frequency on E-cores.
Profiles (--profile, -p)
Section titled “Profiles (--profile, -p)”| Profile | Quantum | Starvation | Use Case |
|---|---|---|---|
| gaming | 2ms | 100ms | (Default) Balanced for most games |
| esports | 1ms | 50ms | Competitive FPS, ultra-low latency |
| legacy | 4ms | 200ms | Older CPUs, battery saving |
| default | 2ms | 100ms | Alias for gaming |
CLI Arguments
Section titled “CLI Arguments”| Argument | Default | Description |
|---|---|---|
--profile, -p <PROFILE> |
gaming |
Select preset profile |
--quantum <µs> |
profile | Base time slice in microseconds |
--new-flow-bonus <µs> |
profile | Extra deficit for newly woken tasks |
--starvation <µs> |
profile | Max run time before forced preemption |
--verbose, -v |
false |
Enable live TUI stats display |
--interval <secs> |
1 |
TUI refresh interval |
Per-Tier Tuning (Gaming Profile)
Section titled “Per-Tier Tuning (Gaming Profile)”| Tier | Quantum Multiplier | Effective Slice | Starvation Limit |
|---|---|---|---|
| T0 Critical | 0.75x | 1.5ms | 3ms |
| T1 Interactive | 1.0x | 2.0ms | 8ms |
| T2 Frame | 1.2x | 2.4ms | 40ms |
| T3 Bulk | 1.4x | 2.8ms | 100ms |
Developed by: Andrea Righi (arighi GitHub)
- Production Ready?
Lightweight scheduler optimized for preserving task-to-CPU locality.
When the system is not saturated, the scheduler prioritizes keeping tasks on the same CPU using local DSQs. This not only maintains locality but also reduces locking contention compared to shared DSQs, enabling good scalability across many CPUs.
- Use cases:
- General-purpose scheduler: the scheduler should adapt itself both for server workloads or desktop workloads.
Scheduler Modes
Section titled “Scheduler Modes”- Command-line Flags: None.
- Description:
Gaming
Section titled “Gaming”- Command-line Flags:
-s 700 -S - Description: Sacrifices throughput for better consistency in Gaming performance by reducing contention on shared SMT cores.
Power Save
Section titled “Power Save”- Command-line Flags:
-m powersave - Description: Prioritizes power efficiency. Favor less performant cores (e.g., E-cores on Intel).
Low Latency
Section titled “Low Latency”- Command-line Flags:
-s 700 -S -m performance -w - Description: Meant to lower latency at the cost of throughput. Suitable for soft real-time applications like Audio Processing and Multimedia. Grants a more uniform load distribution across available cores sacrificing efficiency.
Server
Section titled “Server”- Command-line Flags:
-s 20000 -c 75 -p 250 - Description: Enable address space affinity to improve locality and performance in certain cache-sensitive workloads. Slice duration is set to 20ms and the polling which monitors how often the scheduler compares CPU utilization with the CPU busy threshold to decide when the system is busy.
Developed by: Andrea Righi (arighi GitHub)
Production Ready?
A scheduler that focuses on ensuring fairness among tasks and performance predictability.
It operates using an earliest deadline first (EDF) policy, where each task is assigned a “latency” weight. This weight is dynamically adjusted based on how often a task release the CPU before its full time slice is used.
Tasks that release the CPU early are given a higher latency weight, prioritizing them over tasks that fully consume their time slice.
- Use cases:
- Gaming
- Latency sensitive workloads such as multimedia or real-time audio processing
- Need for responsiveness under over-stressed situations
- Consistency in performance
- Server
Scheduler Modes
Section titled “Scheduler Modes”Low Latency
Section titled “Low Latency”- Command-line Flags:
-m performance -w -C 0 - Description: Meant to lower latency at the cost of throughput. Suitable for soft real-time applications like Audio Processing and Multimedia.
Gaming
Section titled “Gaming”- Command-line Flags:
-m all - Description: Optimizes for high performance in games.
Power Save
Section titled “Power Save”- Command-line Flags:
-m powersave -I 10000 -t 10000 -s 10000 -S 1000 - Description: Prioritizes power efficiency. Favor less performant cores (e.g., E-cores on Intel) and introduces a forced idle cycle every 10ms to increase power saving.
Server
Section titled “Server”- Command-line Flags:
-m all -s 20000 -S 1000 -I -1 -D -L - Description: Tuned for server workloads. Trades responsiveness for throughput.
Developed by: Galih Tama (galpt GitHub)
Production Ready?
scx_flow is a budget-based scheduler that sorts tasks into one of four O(1) FIFO tiers based on how much budget they have left. No heuristics, no scoring algorithms, no adaptive tuning — every decision comes from one number: remaining budget.
- Use cases:
- General-purpose desktop and workstation multitasking
- Gaming with background applications open
- Development work with builds, tests, or containers running
- Any scenario where interactive responsiveness under mixed load matters
- Systems that need deterministic, explainable scheduling (embedded control, robotics, avionics)
How it works — the budget
Section titled “How it works — the budget”Think of every task as having a “responsiveness budget.” While a task is sleeping (waiting for something to do), it accumulates budget. When it wakes up and runs, it spends it. Tasks that wake up still holding budget are a sign of interactivity — they get dispatched immediately to the CPU they last ran on, bypassing the tier system entirely. Tasks that exhaust their budget get re-enqueued into one of four FIFO tiers.
The four dispatch tiers
Section titled “The four dispatch tiers”When a task is re-enqueued (not a wakeup), its remaining budget decides which tier it lands in:
| Tier | Budget threshold | What kind of tasks end up here |
|---|---|---|
| Priority | ≥ 1.5ms | Interactive tasks that sleep often and run briefly |
| Normal | ≥ 1ms | Typical tasks with decent budget left |
| Low | ≥ 0.5ms | Tasks running low on budget |
| Deficit | < 0.5ms | Bulk workers, CPU hogs, background jobs |
Each tier is a plain FIFO queue — O(1) enqueue, O(1) dequeue. No tree walks, no priority recalculations.
No starvation, no priority inversion
Section titled “No starvation, no priority inversion”The dispatch function doesn’t just drain Priority first every time. It rotates the starting tier on every call — gen & 3 decides where to start. So the Deficit tier never waits more than 3 dispatch cycles before it gets serviced first. This means bulk workers make progress even under heavy interactive load, and there’s no priority inversion because no single tier can monopolize the CPU.
Wakeups skip the line entirely
Section titled “Wakeups skip the line entirely”When a task wakes up (it was sleeping and now has something to do), it doesn’t wait in any tier queue. It goes straight to the CPU it last ran on via SCX_DSQ_LOCAL_ON — cache-warm and immediate. This is what keeps interactive tasks snappy: a sleeping Discord or browser tab wakes up with budget and gets dispatched in microseconds, not milliseconds.
Pinned tasks always go first
Section titled “Pinned tasks always go first”Tasks that can’t migrate between CPUs (setaffinity) get their own per-CPU FIFO queue that takes absolute priority over any tier. They’re dispatched before anything from the tier system runs on that CPU.
The result
Section titled “The result”Interactive tasks (keyboard input, UI updates, audio threads, network polling) almost always wake up with budget and get the express lane. CPU-heavy batch work (compilation, downloads, background indexing) drains its budget and settles into the Deficit tier, where it still makes progress thanks to the rotating dispatch. No tuning needed.
No profiles, no autotuning, no modes
Section titled “No profiles, no autotuning, no modes”scx_flow does not have Gaming, Power Save, or Low Latency modes — and unlike earlier versions, it also does not have an adaptive control loop. The rotating tier dispatch and budget thresholds are compile-time constants. What you get is what runs: deterministic, explainable, and identical on every system. If a task has budget, it gets priority. If it doesn’t, it shares the Deficit tier fairly. That’s the whole policy.
Web UI
Section titled “Web UI”When scx_flow starts, it automatically serves a live metrics dashboard at http://localhost:50005. Open it in any browser — no extra flags needed.
The dashboard shows:
- How many dispatches have gone through each tier (Priority / Normal / Low / Deficit)
- System information: running tasks, uptime, total dispatch count
- A tier distribution bar so you can see at a glance whether interactive or bulk work dominates
- Every metric card is clickable — opens a history modal with sparklines and a bar chart
- All values update every second via polling — no page refresh needed
If the page doesn’t load, the scheduler may have stopped running (the kernel falls back to built-in EEVDF).
# Disable the web UI if you don't need it:sudo scx_flow --no-webuiWhen scx_loader is running with systemd hardening that restricts socket families (RestrictAddressFamilies, SocketBindDeny), TCP binding is blocked and scx_flow falls back to a Unix socket at /tmp/scx_flow.sock. In that case, the browser can’t reach the dashboard directly — temporarily run sudo scx_flow --no-webui to silence errors if you don’t need the UI.
CLI Arguments
Section titled “CLI Arguments”| Argument | Description |
|---|---|
--no-webui |
Disable the embedded web UI |
-d, --debug |
Enable debug-level logging |
-V, --version |
Print scheduler version and exit |
Developed by: Andrea Righi (arighi GitHub)
- Production Ready?
scx_forge contains two parts:
- A base AI-Oriented scheduler that is designed to be used in conjunction with the second part.
- Agent intended to be used with the base scheduler to provide a more AI-oriented scheduling experience, plus optimization in place by the agent itself.
The agent allows setting up your AI model, workload you want to optimize for and the overall goal you want to achieve. The agent will then try to optimize the scheduler for your specific workload and goal.
How? via the spec.toml file which is used to start the optimization loop.
Basically this scheduler is perfect for those who want to optimize an specific workload by an AI agent.
To learn more about it, check the scx_forge_agent README.
Developed by: Changwoo Min (multics69 GitHub).
- Production Ready?
Brief introduction to LAVD from Changwoo:
LAVD is a new scheduling algorithm which is still under development. It is motivated by gaming workloads, which are latency-critical and communication-heavy. It aims to minimize latency spikes while maintaining overall good throughput and fair use of CPU time among tasks.
- Use cases:
- Gaming
- Audio Production
- Latency sensitive workloads
- Desktop usage
- Great interactivity under intensive workloads
- Power saving
One of the main and awesome capabilities that LAVD includes is Core Compaction. which without going into technical details: When CPU usage < 50%, Currently active cores will run for longer and at a higher frequency. Meanwhile Idle Cores will stay in C-State (Sleep) for a much longer duration achieving less overall power usage.
Scheduler Modes
Section titled “Scheduler Modes”Gaming & Low Latency
Section titled “Gaming & Low Latency”- Command-line Flags:
--performance - Description: Maximizes performance by using all available cores, prioritizing physical cores.
Power Save
Section titled “Power Save”- Command-line Flags:
--powersave - Description: Minimizes power consumption while maintaining reasonable performance. Prioritizes efficient cores and threads over physical cores.
Developed by: Will Clingan (willclngn GitHub)
A behavioral-classification scheduler with topology-aware placement. EWMA-driven scoring (wakeup frequency, context-switch rate, runtime variance) sorts tasks into three tiers — LAT_CRITICAL, INTERACTIVE, BATCH — each with its own slice, preemption rules, and DSQ routing. Placement is driven by effective resistance (R_eff) on the CPU topology graph, derived from a Laplacian pseudoinverse; per-CPU DSQs are work-stolen in R_eff order to keep cache-hot work cache-hot. Every timing constant — sojourn rescue, CoDel target, vtime ceiling, longrun threshold — derives from a single tau value (the Fiedler eigenvalue’s reciprocal), so the scheduler self-calibrates from 2C laptops to 32C+ servers without tuning. A damped harmonic oscillator adapts the CoDel stall target from rescue pressure each tick. A 1Hz Rust adaptive control loop (multiplicative weights update over six expert profiles) tunes scheduling knobs from BPF histogram telemetry, synced to the BPF oscillator’s state to avoid double-correction. A persistent process database learns task classifications across reboots. NUMA-aware, hotplug-correct.
- Use cases:
- Gaming
- Desktop usage
- Multimedia/audio production
- Codebase compilation
- ZFS / storage-heavy workloads
- Mixed workloads
- Interactivity under sustained CPU saturation
Scheduler Modes
Section titled “Scheduler Modes”Default (Adaptive)
- Command-line Flags: (none — runs adaptive by default)
- Description: Full adaptive mode. The Rust control loop detects workload regime (LIGHT / MIXED / HEAVY) and adjusts scheduling parameters in real-time. Best for general desktop use and gaming.
BPF Only
Section titled “BPF Only”- Command-line Flags:
--no-adaptive - Description: Disables the Rust adaptive control loop. The BPF scheduler runs with static tuning knobs. Lower overhead, useful for benchmarking or if the adaptive layer is overcorrecting on your workload.
Verbose / Debug
Section titled “Verbose / Debug”- Command-line Flags:
-vor--verbose - Description: Enables detailed telemetry output including per-tier dispatch counts, sojourn times, and behavioral classification stats. Useful for diagnosing scheduling behavior.
- Production Ready?
- Yes. If tuned correctly for your specific workload and hardware.
Developed by: Daniel Hodges (hodgesds GitHub)
A general purpose scheduler that focuses on pick two load balancing between LLCs. Keeps high cache locality and work conservation while providing reasonable latency.
- Use cases:
- Server
- Desktop environments
- Gaming (with some manual tuning)
Scheduler Modes
Section titled “Scheduler Modes”Gaming
Section titled “Gaming”- Command-line Flags:
--task-slice true -f --sched-mode performance - Description: Improves consistency in gaming performance and increases bias towards scheduling on higher performance cores.
Low Latency
Section titled “Low Latency”- Command-line Flags:
-y -f --task-slice true - Description: Lowers latency by making interactive tasks stick more to the CPU they were assigned to and increasing the stability on slice time.
Power Save
Section titled “Power Save”- Command-line Flags:
--sched-mode efficiency - Description: Enhances power efficiency by prioritizing power efficient cores.
Server
Section titled “Server”- Command-line Flags:
--keep-running - Description: Improves server workloads by allowing tasks to run beyond their slice if the CPU is idle.
Developed by: Andrea Righi (arighi Github)
- Production Ready?
- This scheduler is still experimental and not recommended for production use.
scx_tickless is a server-oriented scheduler designed for cloud computing, virtualization, and high-performance computing workloads.
The scheduler works by routing all scheduling events through a pool of primary CPUs assigned to handle these events. This allows disabling the scheduler’s tick on other CPUs, reducing OS noise.
- Use cases:
- Cloud computing
- Virtualization
- High performance computing workloads
- Server
Scheduler Modes
Section titled “Scheduler Modes”Gaming
Section titled “Gaming”- Command-line Flags:
-f 5000 -s 5000 - Description: Boosts gaming performance by increasing how often the scheduler detects CPU contention and triggers context switches with a shorter time slice.
Power Save
Section titled “Power Save”- Command-line Flags:
-f 50 - Description: Enhances power efficiency by lowering contention checks.
Low Latency
Section titled “Low Latency”- Command-line Flags:
-f 5000 -s 1000 - Description: Similar to the gaming profile but with a further reduced slice.
Server
Section titled “Server”- Command-line Flags:
-f 100 - Description: Reduced how often the scheduler checks for CPU contention to improve throughput at the cost of responsiveness.
Developed by: Andrea Righi (arighi GitHub)
Production Ready?
For performance-critical production scenarios, other schedulers are likely to exhibit better performance, as offloading all scheduling decisions to user-space comes with a certain cost (even if it’s minimal).
However, a scheduler entirely implemented in user-space holds the potential for seamless integration with sophisticated libraries, tracing tools, external services (e.g., AI), etc.
Hence, there might be situations where the benefits outweigh the overhead, justifying the use of this scheduler in a production environment.
Shares similarities with bpfland, Made with the intention of being easy to read and understand how it works due to its implementation in userspace.
Keep in mind that there is a slight throughput disadvantage when using a userspace scheduler.
- Use cases:
- Low latency workloads (Gaming, video conferences and live streaming)
- Desktop usage
Developed by: David Vernet (Byte-Lab GitHub)
- Production Ready?
- Yes. If tuned correctly,
Rusty offers a wide range of features that enhance its capabilities, providing greater flexibility for various use cases. One of these features is tunability, allowing you to customize Rusty to suit your preferences and specific requirements.
- Use cases:
- Gaming
- Latency sensitive workloads
- Desktop usage
- Multimedia/Audio production
- Great interactivity under intensive workloads
- Power saving
Configuration and performance testing
Section titled “Configuration and performance testing”LAVD Autopilot & Autopower
Section titled “LAVD Autopilot & Autopower”Quotes from Changwoo Min:
-
In autopilot mode, the scheduler adjusts its power mode
Powersave, Balanced, or Performancebased on the system load, specifically CPU utilization -
Autopower: Automatically decide the scheduler’s power mode based on the system’s energy profile aka EPP (Energy Performance Preference).
# Autopower can be activated by the following flag:--autopower# e.g:scx_lavd --autopowerananicy-cpp & sched-ext
Section titled “ananicy-cpp & sched-ext”In order to disable/stop ananicy-cpp, run the following command:
systemctl disable --now ananicy-cppscx_loader Power Profile Switching
Section titled “scx_loader Power Profile Switching”Implemented in the power-profiles-daemon package provided by CachyOS which includes a custom patch to support scx_loader power profile switching.
- If
scx_loaderis currently running, when game-performance is used, it will automatically switch the active scheduler to theGamingprofile when a game is launched, and revert back to the default profile when the game is closed. - When changing between power profiles e.g. in KDE Plasma or GNOME using the power profile switcher,
scx_loaderwill automatically switch to the corresponding scheduler profile:
| Power Profile | Scheduler Profile |
|---|---|
| Power Saver | Power Save |
| Balanced | Auto |
| Performance | Gaming |
Benchmarking and comparing schedulers with cachyos-benchmarker
Section titled “Benchmarking and comparing schedulers with cachyos-benchmarker”The cachyos-benchmarker tool provides an easy way to evaluate and compare the performance of different CPU schedulers.
It runs a comprehensive suite of benchmarks to measure CPU, memory, and overall system performance under various workloads.
The following benchmarks are included:
| Test | Measures | Tool |
|---|---|---|
| stress-ng cpu-cache-mem | CPU, cache, and memory performance | stress-ng |
| FFmpeg compilation | Parallel build performance | make |
| x265 encoding | Video encoding throughput | x265 |
| argon2 hashing | Multithreaded password hashing | argon2 |
| perf sched msg | Context switching and IPC performance | perf |
| perf memcpy | Memory throughput memcpy() |
perf |
| prime calculation | Integer arithmetic and parallelism | primesieve |
| NAMD | Molecular dynamics (scientific workload) | namd3 |
| Blender render | CPU-only 3D rendering | blender |
| xz compression | Compression throughput | xz |
| Kernel defconfig build | Kernel compilation performance | make |
| y-cruncher | Mathematical precision and memory stress | y-cruncher |
cachyos-benchmarker can be used for several purposes, including:
- Testing scheduler stability
Run the full benchmark suite to detect stalls, crashes, or regressions introduced by scheduler changes.
If you are using
scx_loader, you can collect logs in case of a stall or crash with:This will create a file namedTerminal window journalctl --unit scx_loader.service --boot 0 > crash.logcrash.login your current directory. - Comparing scheduler performance
- Evaluate performance differences between schedulers. e.G.
BPFLAND vs LAVD
- Evaluate performance differences between schedulers. e.G.
- Measuring the effect of kernel or scheduler updates
- Compare runs before and after applying patches or version changes to check for performance regressions or improvements.
- Testing configuration tweaks
- Assess the impact of changes such as CPU governor settings, SMT toggling, or modified scheduler flags.
Requirements
Section titled “Requirements”- 4 GB RAM or more
- At least 8 GB of free storage space
- Time and patience - the full benchmark can take over an hour on slower systems
Installation
Section titled “Installation”To install cachyos-benchmarker, run the following command:
sudo pacman -S cachyos-benchmarkerRunning the benchmark
Section titled “Running the benchmark”- Execute
cachyos-benchmarker:Terminal window cachyos-benchmarker ~/cachyos-benchmarker/# You can replace ~/cachyos-benchmarker/ with any directory you want the logs to be saved in. - Wait until the preparation steps finish.
- Follow the prompts:
Do you want to drop page cache now? Root privileges needed! (y/N) yPlease enter a name for this run, or leave empty for default:
- Wait for the tests to finish.
- Once finished, the following will happen:
- Creation of a log file with name like
benchie_<name>_<DATE>.logwhich contains detailed information about the benchmark run.- Example:
benchie_p2dq_2025-09-29-2115.log - The
benchmark_scraper.pyscript will automatically execute to generate a summary report in HTML format. - What does the script do?:
- Reads all
benchie_*.logfiles in the specified directory. - Extracts the benchmark names, times, and scores.
- Sorts or aggregates them.
- Prints a clean summary of the results to your terminal and creates an HTML file that can be opened in a browser.
Terminal output example:
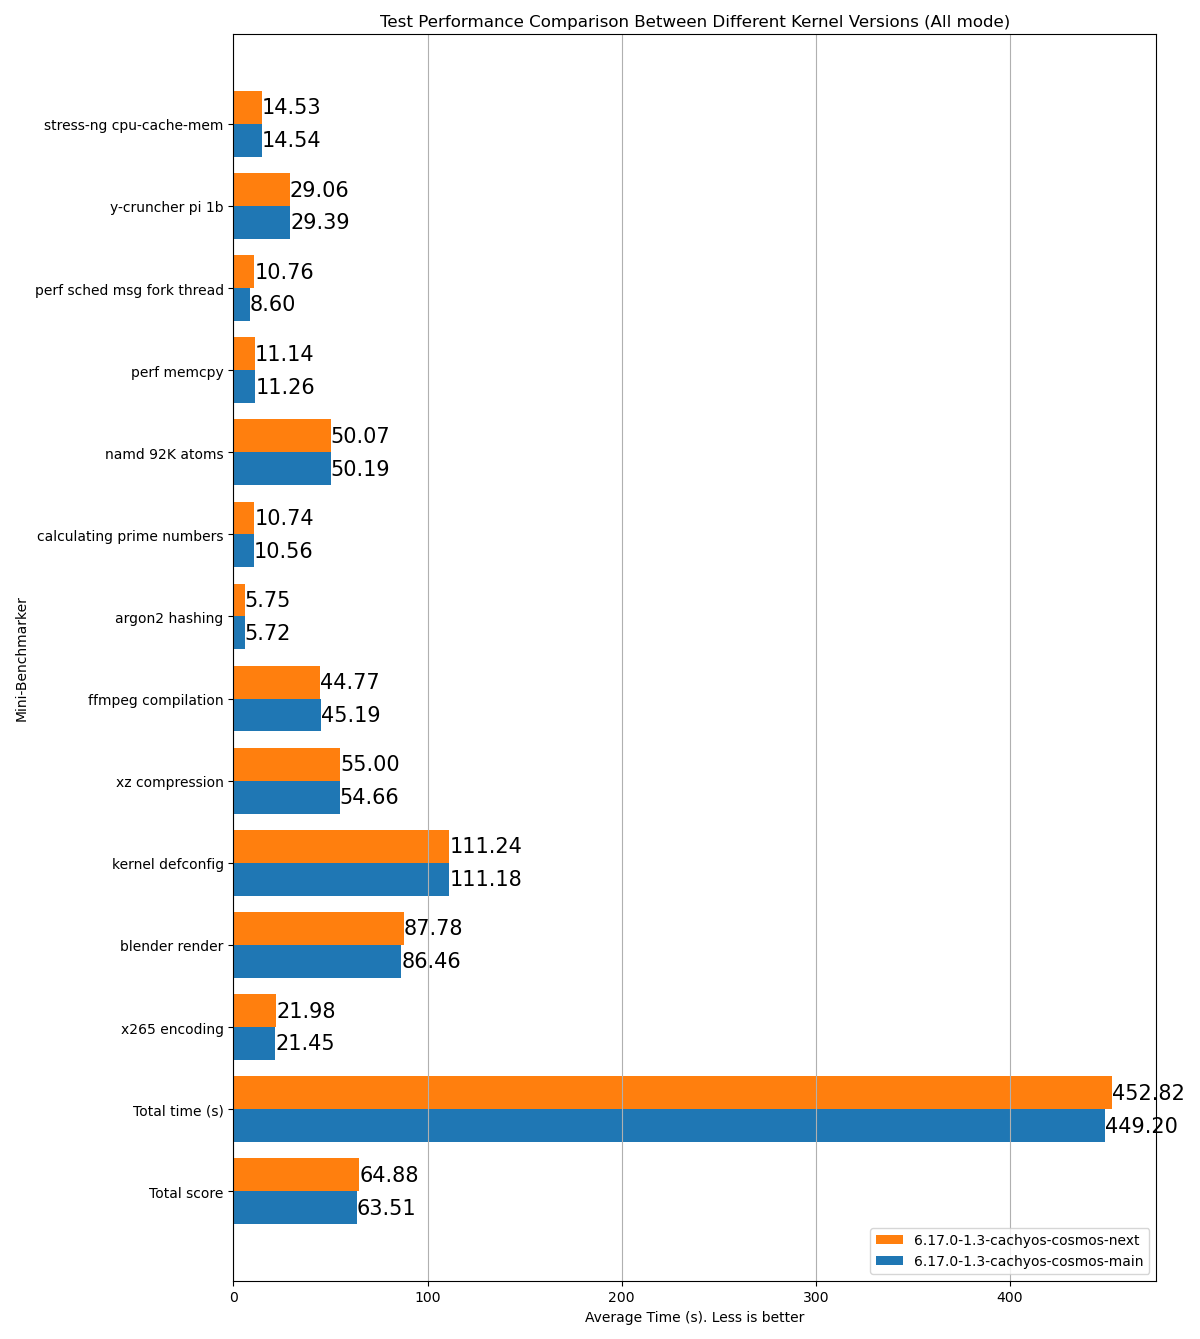
stress-ng cpu-cache-mem: 15.26y-cruncher pi 1b: 31.23perf sched msg fork thread: 8.892perf memcpy: 13.53namd 92K atoms: 53.54calculating prime numbers: 11.126argon2 hashing: 6.62ffmpeg compilation: 53.38xz compression: 61.13kernel defconfig: 130.73blender render: 96.29x265 encoding: 24.99Total time (s): 506.72Total score: 70.71Name: p2dqDate: 2025-09-29-2115System: Kernel: 6.17.0-1.1-cachyos-p2dq arch: x86_64 bits: 64Desktop: KDE Plasma v: 6.4.5 Distro: CachyOSMemory: System RAM: total: 32 GiB available: 30.61 GiB used: 7.54 GiB (24.6%)Device-1: Channel-A DIMM 0 type: LPDDR5 size: 8 GiB speed: 7500 MT/sDevice-2: Channel-B DIMM 0 type: LPDDR5 size: 8 GiB speed: 7500 MT/sDevice-3: Channel-C DIMM 0 type: LPDDR5 size: 8 GiB speed: 7500 MT/sDevice-4: Channel-D DIMM 0 type: LPDDR5 size: 8 GiB speed: 7500 MT/sCPU: Info: 8-core model: AMD Ryzen 7 8845HS w/ Radeon 780M Graphics bits: 64 type: MT MCP cache: L2: 8 MiBSpeed (MHz): avg: 3366 min/max: 419/5138 cores: 1: 3366 2: 3366 3: 3366 4: 3366 5: 3366 6: 3366 7: 3366 8: 3366 9: 3366 10: 3366 11: 3366 12: 3366 13: 3366 14: 3366 15: 3366 16: 3366SCX Scheduler: p2dq_1.0.21_gf90c2aa1_dirty_x86_64_unknown_linux_gnuSCX Version: p2dq_1.0.21_gf90c2aa1_dirty_x86_64_unknown_linux_gnuVersion : 0.5.1-1HTML example of a test result comparing two different branches of the same scheduler:
- Reads all
- Example:
- Creation of a log file with name like
- To compare two or more runs, place the
.logfiles in the same directory before runningbenchmark_scraper.py. The tool will automatically detect and compare them in the HTML report.
Testing scheduler latency with schbench
Section titled “Testing scheduler latency with schbench”schbench is a scheduler benchmark designed to measure scheduler latency under a simulated server-style workload. It spawns a configurable number of “worker” and “message” threads, where messages repeatedly wake up workers. By measuring the latency distribution from wakeup to execution of these worker threads, it provides critical insight into a kernel’s ability to handle thread wakeups, balancing, and CPU contention, especially under load.
Use cases
Section titled “Use cases”You can use schbench to:
- Evaluate scheduler latency: Identify how quickly threads are scheduled after waking up.
- Compare wakeup performance between schedulers: Detect improvements or regressions in context switching and wakeup latency.
- Test the effect of kernel or scheduler patches: Assess if tuning or updates affect scheduling fairness and responsiveness.
Installation
Section titled “Installation”schbench is available in the CachyOS repositories:
sudo pacman -S schbenchRunning the benchmark
Section titled “Running the benchmark”A simple way to run schbenchfor a general latency test is:
schbench -m 2 -t 8 -r 60This example runs:
- 2 message threads (
-m 2) - 8 worker threads per message thread (
-t 8) - for 60 seconds total runtime (
-r 60)
You can adjust these values depending on your CPU core count and the desired load level.
Here is a table explaining some of the key options:
| Option | Description |
|---|---|
-C, --calibrate |
Run calibration and report timing (no benchmark). |
-L, --no-locking |
Disable spinlocks during CPU work (default: locking enabled). |
-m, --message-threads <n> |
Number of message threads (default: 1). |
-t, --threads <n> |
Worker threads per message thread (default: number of CPUs). |
-r, --runtime <sec> |
Benchmark duration (default: 30). |
-F, --cache_footprint <KB> |
Cache footprint size (default: 256). |
-n, --operations <count> |
Number of “think time” operations to perform (default: 5). |
-A, --auto-rps |
Automatically grow RPS until CPU utilization target is reached. |
-R, --rps <count> |
Requests per second mode. |
-p, --pipe <bytes> |
Simulate a pipe transfer test. |
-w, --warmuptime <sec> |
Warm-up duration before collecting stats (default: 0). |
-i, --intervaltime <sec> |
Interval for printing latencies (default: 10). |
-z, --zerotime <sec> |
Interval for zeroing latency stats (default: never). |
Understanding the output
Section titled “Understanding the output”After each run, schbench prints latency percentiles like:
Output example
Wakeup Latencies percentiles (usec) runtime 10 (s) (2406 total samples) 50.0th: 60 (648 samples) 90.0th: 2034 (968 samples)* 99.0th: 4104 (211 samples) 99.9th: 10128 (22 samples) min=1, max=10308Request Latencies percentiles (usec) runtime 10 (s) (2394 total samples) 50.0th: 49216 (726 samples) 90.0th: 69760 (954 samples)* 99.0th: 166656 (212 samples) 99.9th: 273920 (21 samples) min=11770, max=334247RPS percentiles (requests) runtime 10 (s) (11 total samples) 20.0th: 234 (3 samples)* 50.0th: 238 (3 samples) 90.0th: 241 (4 samples) min=230, max=248current rps: 230.99Wakeup Latencies percentiles (usec) runtime 10 (s) (2406 total samples) 50.0th: 60 (648 samples) 90.0th: 2034 (968 samples)* 99.0th: 4104 (211 samples) 99.9th: 10128 (22 samples) min=1, max=10308Request Latencies percentiles (usec) runtime 10 (s) (2406 total samples) 50.0th: 49216 (729 samples) 90.0th: 69760 (956 samples)* 99.0th: 165632 (212 samples) 99.9th: 273920 (22 samples) min=11770, max=334247RPS percentiles (requests) runtime 10 (s) (11 total samples) 20.0th: 234 (3 samples)* 50.0th: 238 (3 samples) 90.0th: 241 (4 samples) min=230, max=248average rps: 240.60How to interpret the results
Section titled “How to interpret the results”- Wakeup Latencies:
- Measures how quickly threads wake up after being signaled.
- Lower values here (especially the 99th percentile) mean the scheduler is more responsive.
- Measures how quickly threads wake up after being signaled.
- Request Latencies:
- Represents the time taken to complete requests between threads.
- Lower latency indicates better inter-thread communication and scheduling efficiency.
- Represents the time taken to complete requests between threads.
- RPS (Requests Per Second):
- Shows the sustained throughput:
- A higher average RPS indicates the scheduler can handle more work per second under the given configuration.
- Shows the sustained throughput:
In conclusion:
- A good scheduler will show low wakeup and request latencies with consistent RPS.
- A less efficient scheduler may exhibit high latency spikes or unstable RPS values over time.
Recommendations for benchmarking games
Section titled “Recommendations for benchmarking games”If your desire is to benchmark games to compare how different schedulers perform, here are some tips to get the most accurate results:
- Use built-in benchmarks: Many modern games come with built-in benchmarking tools. These are designed to provide consistent results by running the same sequence of events each time.
- Check out this website for a list of games that include built-in benchmarks.
- Consistent settings: Ensure that the game settings (resolution, graphics quality, etc.) are the same for each test run.
- Close background applications: Other applications running in the background can affect performance. Close unnecessary programs to minimize their impact.
- If you’re not using a built-in benchmark, try to perform the same actions in the game for each test run. This could include following the same path, engaging in similar combat scenarios, or performing the same tasks.
- Even not aiming at the same spot can lead to different performance results.
- Multiple runs: Perform multiple runs of the benchmark and take the average to account for variability.
- Use performance monitoring tools: Tools like MangoHud or GOverlay can provide realtime performance metrics such as FPS, frame times, and CPU/GPU usage.
- Take advantage of keyboard shortcuts or macros:
- One example is to create a keybinding on which you can switch between different schedulers or change their modes on the fly while in-game.
- This can be done using a tool like scxctl or by creating custom scripts that change the active scheduler and its mode.
- One example is to create a keybinding on which you can switch between different schedulers or change their modes on the fly while in-game.
Uploading and sharing your benchmarks
Section titled “Uploading and sharing your benchmarks”This website contains a list of benchmarks done by the community using different schedulers or testing various settings.
In order to upload your own benchmarks. You’ll have to link your Discord account to the website and then you can submit your own benchmarks.
Then click on the New benchmark button and fill in the required information.
- You can upload multiple results for the same game using different schedulers or settings.
- Accepts both MangoHud and Afterburner logs.
- Allows searching by title or description.
scx_loader Configuration
Section titled “scx_loader Configuration”Setting a scheduler as default (on boot)
Section titled “Setting a scheduler as default (on boot)”To set a scheduler to start automatically when scx_loader starts (e.g., on boot), follow these steps:
-
Copy the example configuration file to the configuration directory:
Terminal window sudo mkdir -p /etc/scx_loadersudo cp /usr/share/scx_loader/config.toml /etc/scx_loader/config.toml -
Edit the configuration file with your preferred editor:
Terminal window sudo nano /etc/scx_loader/config.toml -
Set the default scheduler and mode. For example, to set
scx_pandemoniuminAutomode:# This field specifies the scheduler that will be started automatically when scx_loader starts (e.g., on boot).default_sched = "scx_pandemonium"# This field specifies the mode which will be used when scx_loader starts (e.g., on boot).default_mode = "Auto" -
Enable and start the service:
Terminal window sudo systemctl enable --now scx_loader.service
Configuration Lookup Order
Section titled “Configuration Lookup Order”scx_loader searches for the configuration file in the following order:
/etc/scx_loader/config.toml(Preferred)/etc/scx_loader.toml/usr/share/scx_loader/config.toml(Default template)/usr/share/scx_loader.toml
Customizing Scheduler Arguments
Section titled “Customizing Scheduler Arguments”You can customize the arguments passed to each scheduler for different modes by adding a [scheds.scx_name] section to your configuration file.
For detailed information and examples on how to configure per-scheduler arguments, please refer to the scx_loader configuration documentation.
Transitioning from scx.service to scx_loader: A Comprehensive Guide
Section titled “Transitioning from scx.service to scx_loader: A Comprehensive Guide”First let’s start with a close-up comparison between the scx.service file structure against the scx_loader configuration file structure.
If you previously had LAVD running with the old scx.service like this example below:
# List of scx_schedulers: scx_bpfland scx_central scx_flash scx_lavd scx_layered scx_nest scx_qmap scx_rlfifo scx_rustland scx_rusty scx_simple scx_userlandSCX_SCHEDULER=scx_lavd
# Set custom flags for the schedulerSCX_FLAGS='--performance'
Then the equivalent on the scx_loader configuration file will look like:
default_sched = "scx_lavd"default_mode = "Auto"
[scheds.scx_lavd]auto_mode = ["--performance"]
For more information on how to configure the scx_loader file
Follow the guide below for an easy transition from the scx systemd service to the new scx_loader utility.
-
Disabling scx.service in favor of the scx_loader.service systemctl disable --now scx.service && systemctl enable --now scx_loader.service -
Creating the configuration file for the scx_loader and adding the default structure # Micro editor is going to create a new file.sudo micro /etc/scx_loader.toml# Add the following lines:default_sched = "scx_bpfland" # Edit this line to the scheduler you want scx_loader to start at bootdefault_mode = "Auto" # Possible values: "Auto", "Gaming", "LowLatency", "PowerSave".# Press CTRL + S to save changes and CTRL + Q to exit Micro. -
Restarting the scx_loader systemctl restart scx_loader.service- You’re done, the scx_loader will now load and start the desired scheduler.
Debugging in the scx_loader
Section titled “Debugging in the scx_loader”-
Checking the service status systemctl status scx_loader.service -
Viewing all the service log entries journalctl -u scx_loader.service -
Viewing only the logs of the current session. journalctl -u scx_loader.service -b 0
In order to get a more detailed log, follow these steps.
-
Edit the service file sudo systemctl edit scx_loader.service -
Add the following line under the [Service] section Environment=RUST_LOG=trace -
Restart the service sudo systemctl restart scx_loader.service - Check the logs again for a more detailed debugging information.
There are so many options… why wouldn’t you just make one scheduler that is good at everything?
Section titled “There are so many options… why wouldn’t you just make one scheduler that is good at everything?”The main reason is that there is no one-size-fits-all solution when it comes to CPU scheduling. Different workloads have different requirements and priorities, and a scheduler that is optimized for one type of workload may not perform well for another.
You could view CPU schedulers as different pairs of shoes, each designed for a specific activity. For example, running a game on a scheduler that is optimized for server workloads may lead to suboptimal performance and increased latency, while using a scheduler designed for gaming on a server may result in inefficient resource utilization and reduced throughput.
That’s the magic of sched-ext. Limitations are no longer a problem.
Why X scheduler performs worse than the other?
Section titled “Why X scheduler performs worse than the other?”- There are many variables to consider when comparing them. For example, how do they measure a task’s weight? Do they prioritize interactive tasks over non-interactive ones? Ultimately, it depends on their design choices.
Why everyone keeps saying this X scheduler is the best for X case but it does not perform as well for me?
Section titled “Why everyone keeps saying this X scheduler is the best for X case but it does not perform as well for me?”- Like the previous answer, the choice of CPU and its design such as the core layout, how they share cache across the cores and other related factors can lead to the scheduler operating less efficiently.
- That’s why having choices is one of the highlights from the sched-ext framework, so don’t be scared to try one and see which one works best for your use case.
Examples: fps stability, maximum performance, responsiveness under intensive workloads etc.
The use cases of these schedulers are quite similar… why is that?
Section titled “The use cases of these schedulers are quite similar… why is that?”Primarily because they are multipurpose schedulers, which means they can accommodate a variety of workloads, even if they may not excel in every area.
- To determine which scheduler suits you best, there’s no better advice than to try it out for yourself.
Why am I missing a scheduler that some users are mentioning or testing in the CachyOS Discord server?
Section titled “Why am I missing a scheduler that some users are mentioning or testing in the CachyOS Discord server?”Make sure you’re using the bleeding edge version of the scx-scheds package named as scx-scheds-git
- One of the reasons will be that this scheduler is very new and is currently being tested by the users, therefore it has not yet been added to the
scx-scheds-gitpackage.
Why did the scheduler suddenly crash? Is it unstable?
Section titled “Why did the scheduler suddenly crash? Is it unstable?”- There could be a few reasons on why this happened:
- One of the most common reason is that you were using ananicy-cpp alongside the scheduler. This why we added this warning
- Another reason could be that the workload you were running exceeded the limits and capacity of the scheduler causing it to stall.
- Example of an unreasonable workload:
hackbench
- Example of an unreasonable workload:
- Or the more obvious reason, you’ve found a bug in the scheduler, if so. Please report it as an issue in their GitHub or let them know
about it in the CachyOS Discord channel
sched-ext
I have previously used the scx_loader in the Kernel Manager GUI. Do I still need to follow the transition steps?
Section titled “I have previously used the scx_loader in the Kernel Manager GUI. Do I still need to follow the transition steps?”- In this particular case, no, it is not necessary because the Kernel Manager already handles the transition process.
- Unless you have previously added custom flags in
/etc/default/scxand still want to use them.
- Unless you have previously added custom flags in
Learn More
Section titled “Learn More”- Sched_ext YT playlist
- LWN: The extensible scheduler class (February, 2023)
- arighi’s blog: Implement your own kernel CPU scheduler in Ubuntu with sched_ext (July, 2023)
- David Vernet’s talk : Kernel Recipes 2023 - sched_ext: pluggable scheduling in the Linux kernel (September, 2023)
- Changwoo’s blog: sched_ext: a BPF-extensible scheduler class (Part 1) (December, 2023)
- arighi’s blog: Getting started with sched_ext development (April, 2024)
- Changwoo’s blog: sched_ext: scheduler architecture and interfaces (Part 2) (June, 2024)
- arighi’s YT channel: scx_bpfland Linux scheduler demo: topology awareness (August, 2024)
- David Vernet’s talk: Kernel Recipes 2024 - Scheduling with superpowers: Using sched_ext to get big perf gains (September, 2024)